

The Question
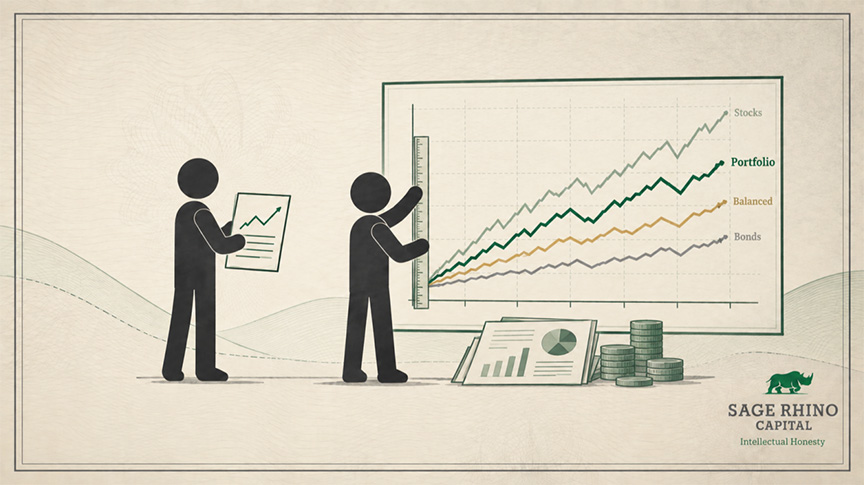
A portfolio is up for the year, but the index is up more. Or the portfolio is down, and the index is down less. Either way, the question comes up: are we behind?
The real question isn’t “am I beating the market.” It’s “what am I measuring against, and does that measure have anything to do with what this money is supposed to do.”
Three Angles
I. Measure against a market benchmark.
A broad index is an honest yardstick for opportunity cost: it shows what a reasonable, low-cost alternative would have done with the same money. The cost: one index is a narrow ruler for an entire portfolio. Today, ten companies make up roughly 39% of the S&P 500, so a diversified portfolio holding bonds, international stocks, and cash will almost always look “behind” in a year those ten lead, even when it’s doing exactly what it was built to do.
II. Measure against the plan.
What return does the plan actually require, given your spending, your timeline, and the cushion you want? A portfolio that’s down, or lagging one index, can still be meeting or beating those objectives. The cost: this only works if the plan exists with real numbers attached, and a plan can be built so loosely that “on track” hides years of underperformance.
III.Don’t measure. Go by feel.
It optimizes for peace of mind and avoids comparison anxiety. The cost: feel is a poor instrument. A portfolio that “worked” because it never lost money, say one sitting mostly in cash for a decade, can feel safe while failing at the one job money in a portfolio exists to do.
What’s Being Said
There is no single benchmark for the combined assets of a portfolio. Here are three widely used ones over the same ten calendar years, 2016 through 2025, with each one’s average annual return and its best and worst single year:
U.S. Total Stock Market: about 14.3% a year, with a best year of +30.7% and a worst year of -19.5%.
U.S. bonds: about 2.0% a year, with a best year of +8.7% and a worst year of -13.0%.
Total international stocks: about 8.5% a year, with a best year of +32.4% and a worst year of -16.1%.
Same decade, same markets, and the leader kept changing. U.S. stocks finished first among the three in six of the ten years, international stocks in two (2017 and 2025), and bonds in two (2018 and 2022, the two years U.S. stocks fell). None of the three won every year, and none announced in advance which year it would win. So which one does an investor choose as the yardstick? The honest answer is that no single one of them describes a portfolio built from all three.
Where to Start
Not with the benchmark, but with the objective. What does this money need to do, and what would a portfolio that does it look like? Write that down with real numbers: the return required, the spending it supports, and the cushion that lets you sleep.
Reviewing the portfolio matters, and it’s how you catch real drift. But the fair review compares each piece to a yardstick that fits its job, not the whole portfolio to one index. A portfolio that doesn’t match the S&P 500 isn’t failing. It was never built to be the S&P 500.
The Reframe
“F“You don’t need to match a benchmark to be on track. You need a plan to measure against, and a plan that helps meet the objective.”nding a loss is easy. Deciding it’s worth taking is the strategy.”
Sources
Total Real Returns, calendar-year total returns for VTI and VXUS -> https://totalrealreturns.com/n/VTI,VT,VXUS (Vanguard Total Stock Market ETF and Vanguard Total International Stock ETF, dividends reinvested, 2016-2025; averages shown are compound annual returns)
Hartford Funds, Bloomberg US Aggregate Bond Index calendar-year returns -> https://dr.hartfordfunds.com/dam/en/docs/pub/whitepapers/CCWP135.pdf (2016-2025)
Apollo Academy, top 10 share of the S&P 500 -> https://www.apolloacademy.com/wp-content/uploads/2026/03/031426-Chart_v2.pdf (Bloomberg data; top 10 at roughly 39%)